Data Analytics Workflow
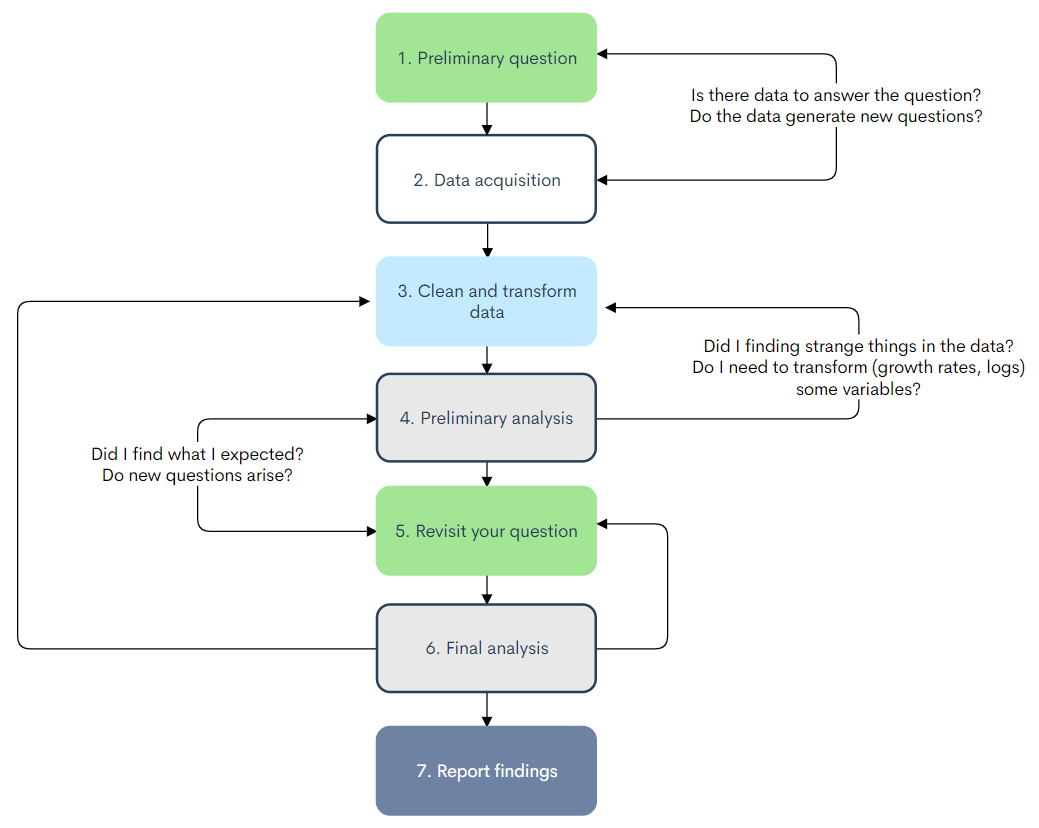
Data analytics workflow
How do research projects proceed?
Every project is a bit different, but there are some general patterns.
Workflow
Pose a preliminary question
Find the appropriate data
Get the data into usable form
Preliminary analysis
Revisit and revise preliminary questions
Final analysis
Report your results
1. Pose a preliminary question
What do you want to know? Why is it interesting?
Your question may (and probably will) change depending on what you find in the data.
2. Find the appropriate data
You will likely cycle back and forth between question and data in the very early stages.
Some questions are great, but we do not have the data to answer them.
Sometimes we start looking at the data and realize the preliminary question is not quite the right one. That's okay: Go back and revise it!
3. Get the data into usable form
- Load the data
- Clean data
- Deal with missing values and outliers
- Merge data sets
- Transform variables
- Sanity checks: Are the types correct? Do the variables have the right signs?
This is where you will spend a lot of time. Survey results reported by Forbes show that data cleaning is the most time consuming and most unpleasant task. The better we are at these tasks, the easier our lives will be.
4. Preliminary analysis
Time to get to work answering our question. Do we see patterns that suggest an answer to our question?
- Plots...lots of plots
- Summary statistics
- Simple correlations
- Regressions
At this point, your plots are for you and your team's consumption, so they do not have to be perfect. You should be thinking, however, about how the final plots will look.
5. Revisit and revise your questions
- Does your analysis, so far, point to an answer to your questions?
- If not, revise your questions
- Does your analysis, so far, raise new questions?
6. Final analysis
- By this point you are pretty sure you can answer your question, or some version of it.
- Develop more formal models. Regression analysis? Machine learning?
- Do they strengthen your answer?
- Do not add complicated analysis only to impress. You are more likely to confuse.
- Create the final visualizations you will use in your report.
- Perform robustness checks.
7. Report your findings
- Reporting is the most important part of your analysis.
- If people cannot understand what you have found, your work loses value.
- This is where your economic training helps. We ask and answer questions.
- Know your audience. Is this for technical readers? CEOs? Marketing execs?
- Your figures should be immaculate.
- Report only what is necessary. Do not get bogged down in details. [Unless the audience wants details.]
A common mistake at this step is presenting the results in the order that they were "discovered." Do not take this approach! Instead, report your results in the way that best leads the reader to your question's answer.
More on communication
Hugo Bowne-Anderson via Harvard Business Review
"The vast majority of my guests tell [me] that the key skills for data scientists are...the abilities to learn on the fly and to communicate well in order to answer business questions, explaining complex results to nontechnical stakeholders."
The whole article is interesting...